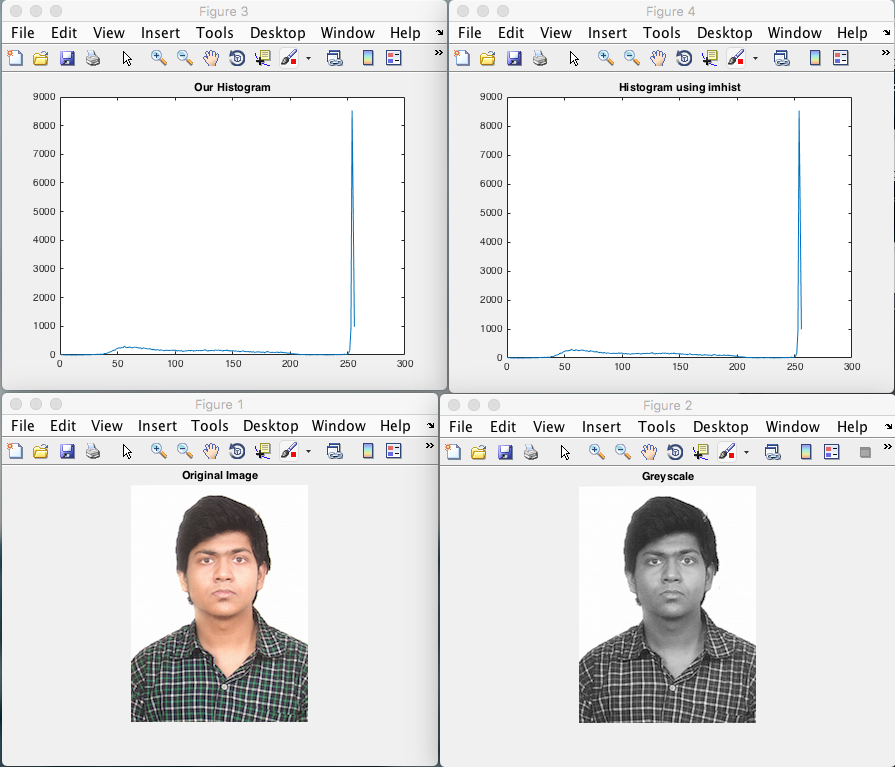
Write a MATLAB script to calculate and plot a histogram of a given image .
**Check the plotted histogram vs the Histogram created using imhist().
**If both the histograms look similar , then the code is correct.
**The first step for calculating a histogram will be finding out the gray image of the input image .
Try to do this also using custom code and not use rgb2gray()
OUTPUT

Feel free to download and use this code.
** For those who do not have access to MATLAB ( extremely expensive !!! ) , i will be releasing similar code in OpenCV soon . **
If you can suggest any optimisations , or useful changes to the given code , then do leave your valuable suggestions as comments .
No comments:
Post a Comment